Phantom Organisation for Chronic Waste

Phantom Organisation for Chronic Waste

Challenges for Structured Quality Improvement Is quality popular in the corporate world? In theory perhaps. Not in practice. Is quality a fully delegable responsibility? No. What are the challenges to muster support for a Structured Quality Improvement (Quality Capsule # 005) initiative? The key one 

STRUCTURED QUALITY IMPROVEMENT – FABLE 3

STRUCTURED QUALITY IMPROVEMENT – FABLE 3

So we have now been introduced to Structured Quality Improvement: Problem Definition (Quality Capsule 5) Problem Diagnosis (Quality Capsule 6) Problem Remedy (Quality Capsule 7) Locking the Improvement (Quality Capsule 8). Problem Definition is the key. A wrong definition leads to a wrong problem being 

QUALITY TOOL: SCATTER DIAGRAMS

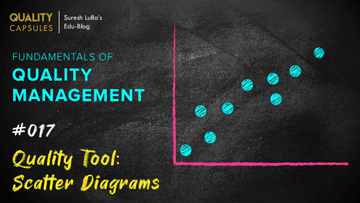
QUALITY TOOL: SCATTER DIAGRAMS

Understanding Relationships Identifying the true cause of a problem is the key to effective quality improvement. When we use Scatter Diagrams for the diagnosis of a problem, we are basically looking for a relationship between two measurable variables. We hope to discover an insight into 

QUALITY TOOL: HISTOGRAMS

QUALITY TOOL: HISTOGRAMS

Variation We are all aware that variation is everywhere. It is inevitable in the output of any process – manufacturing, service, or administrative. We also know it is impossible to keep all factors, in a constant state, all the time. This is one of the 

QUALITY TOOL: PARETO ANALYSIS

QUALITY TOOL: PARETO ANALYSIS

History Pareto Analysis gets its name from the Italian-born economist Vilfredo Pareto (1848-1923) who observed that a relative few people held the majority of wealth. Dr Joseph Juran was the first to point out that what Pareto had observed, was a universal principle. More specifically, 

QUALITY TOOL: DATA COLLECTION

QUALITY TOOL: DATA COLLECTION

This week I will keep my promise of introducing Data Collection, the most misunderstood quality tool….the hatchery for COPQ. Context How often has your boss instructed you: Go get the data. You toil for 10 days and return with the data you believe what your