STRUCTURED QUALITY IMPROVEMENT: PROBLEM REMEDY

I believe: Proficiency with quality tools facilitates accelerated transformation.
How often have you observed that quality is an orphan in an organization? As a result, quality does not find a place in strategic planning. Quality remains a mundane quality control function in operations.
In my view, human resources and operations should report to quality.
Here are a few insights:
- Customer defines quality
- People make quality
- Process capability is to quality planning, what budget is to financial planning.
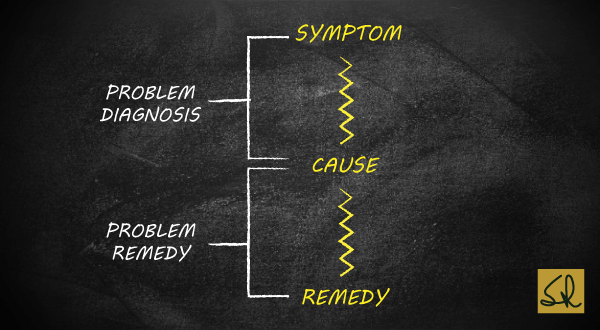
Problem Remedy
Problem Remedy is the third step in the quality improvement methodology. This is the joint responsibility of the project team and impacted people:
- Consider Alternative Solutions
- Design Solutions and Controls
- Address Resistance to Change
- Implement Solutions and Controls
The first step for this expanded team involves ideating for potential remedies. A remedy, or a solution, is a set of changes in the process that will prevent future occurrences of the problem by eliminating or drastically reducing the causes.
Quality Tools: Flow Diagram; Data Gathering; Stratification; Cause-Effect Diagram.
The final selection of a solution will depend on a variety of criteria such as cost, time required to implement, potential resistance, impact on other processes, etc. The detailed design of the final solution solutions and controls will typically involve a Flow Diagram to describe process changes and use of Data-Analysis tools to set up monitoring and control systems.
Quality Tools: Flow Diagram; Data Gathering; Graphs and Charts; Stratification; Histogram; Scatter Diagram; Box Plot.
In dealing with chronic problems, we must keep in mind that the problem process has existed for some time. The people associated with the process may resist change. Breakthroughs in cultural patterns will not occur unless this resistance to change is addressed.
Quality Tools: Flow Diagram; Brainstorming; Cause-Effect Diagram.
Implementation is a joint responsibility of the quality improvement team and the members of the operating department. It is recommended that the remedy is implemented on a small-scale basis at first. Adjustments and fine tuning can be made during full-scale implementation.
Quality Tools: Flow Diagram; Graphs and Charts; Pareto Analysis; Histogram; Scatter Diagram; Box Plots.
I will discuss Locking the Improvement in my next edu-blog on Wednesday, 26 August.
Now, refer to the question I had asked last week in Quality Capsule 6: Which quality tool is most misunderstood?
Hold your breath…Data Gathering. Learning to “ask the right questions” is the key skill in effective data gathering.
The key steps are:
- Formulate the question we are seeking an answer to
- Collect the data relating to that question
- Analyse the data to determine the factual answer to the question
- Present the data so that it clearly communicates the answer to the question
My question to you this week is: Which is the most frequently used quality tool?
Additional References:
Quality Improvement Toolbox
Certified Quality Improvement Associate

Histograms
Comment is on: “In my view, human resources and operations should report to quality. “:
Another way to think of the same is that the owners and CEO must own the quality just like they own the financials and all other aspects of the business. A “No Excuse ” ownership. The business owners can be the board of directors or whatever structure represents them.
Once that is the case, the CEO should decide organization and select the people to run it. No constraints. Each business can be structured to its own needs.
The CEO must establish quality as an attitude, not a department. The quality department, if any, is for some special & specific technical skills , mandatory requirements, internal audits, internal inspections etc.
Good post, Mr. Lulla.
The design thinking process draws a lot of inspiration from the quality process.
Your answer to the most misunderstood quality tool was reassuring. A few years ago when things were a bit rougher than usual, I was being considered for a senior innovation role at one of India’s top IT companies. After smooth sailing rounds, the last one was with the CTO, with whom I locked horns over a similar question.
He was certain prototyping was the single most important stage of the 5-step DT process (if I had to pick one), and I was certain it was the first, the empathetic research/ data gathering one, as it built the foundation, tone and direction for everything afterward.
Taking that lightly increases risks of delays, costs, drop in team momentum and disappointment for clients we’re innovating for. No amount of reasoning helped.
Guess he took the safe way out by not hiring me. 🤣
Their mindset was concerning, considering they did client projects and workshops in India and abroad.
As for this week’s Q, I guess the Cause-&-Effect diagram is the most frequently used tool.