QUALITY TOOL: CAUSE-EFFECT DIAGRAMS

Author’s Tip
Re-read Quality Capsule 6 – Structured Quality Improvement: Problem Diagnosis.
Basics
In Quality Capsule 11 we were introduced to the power of right-brain Brainstorming. In other words, creative thinking. Creative thinking is the basis for developing an innovative solution / remedy.
I also hope you have researched Imaginary Brainstorming and Brainwriting 6-3-5. These two techniques generate a flood of ideas.
In this Quality Capsule on Cause-Effect Diagram, I wish to introduce a tool that can establish a roadmap for testing hypotheses (ideas generated in Brainstorming). The most important consideration in a cause-effect diagram is having a clear understanding of the logical relationship between cause and effect.
It should be noted that a cause-effect diagram will not indicate which causes are creating a problem. All the potential causes are factored in. Further, it will not be known how much each is contributing to the problem. Measurement will be done as a next step, when relevant data are gathered and analysed with respect to one or more hypotheses on the cause-effect diagram.
Please note, the cause-effect diagram facilitates team communication with the Quality Council. This is the USP of this tool.
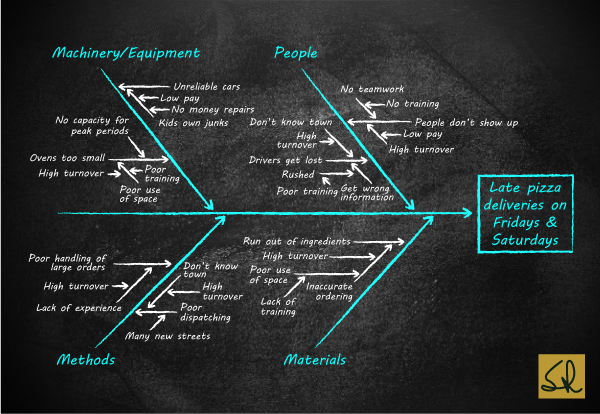
Cause-Effect Diagram / Fishbone Diagram
Potential Pitfalls and Problems in Interpretation
The most serious misinterpretation of a cause-effect diagram is to confuse the orderly arrangement of hypotheses as being real data.
Another common pitfall is to begin construction of the diagram before the symptoms of the chronic problem have been analysed as thoroughly as existing information will permit.
A final pitfall is to limit the hypotheses for rapid construction of the cause-effect diagram.
Insight
The cause-effect diagram does not provide an answer to a question, as some other tools do. Its main value is to serve as a vehicle for organizing a list of all known or suspected causes that potentially contribute to the observed effect (the symptom of the chronic problem).
The cause-effect tree (known to IT professionals) is conceptually similar to the cause-effect diagram.
Next
In my next edu-blog, on Wednesday 30 September, I will introduce Data Collection. This is the most misunderstood quality tool…..a hatchery for substantial COPQ.
One of my favourite analytical tools, very powerful because it involves everyone, it helps think Effect-cause and takes away attention from affixing blame.
The biggest pitfall of this tool is that it is implemented casually or not at all! There is no rigour in finding all possible causes.
Another pitfall is not using it on the shop floor as a “living” document to be updated at each instance of the occurrence of the effect. If done, this could solve the problem of “no root cause analysis done” and empower the floor people to take preventive actions.
I believe if we can genuinely use this tool, no advanced analytics may be required to solve the problem.