QUALITY TOOL: HISTOGRAMS

Variation
We are all aware that variation is everywhere. It is inevitable in the output of any process – manufacturing, service, or administrative.
We also know it is impossible to keep all factors, in a constant state, all the time. This is one of the key challenges for a quality improvement team. More specifically, to reduce variability.
A Histogram is a graphic summary of variation in a set of data. The pictorial nature of the histogram enables us to see patterns that are difficult to see in a simple table of numbers. Histograms enable quality improvement teams to diagnose problems with a x-ray vision.
At a macro level, there are three important characteristics of a histogram:
- The centre
- The width
- The shape.
These three characteristics also point quality improvement teams to the COPQ resident in a process.
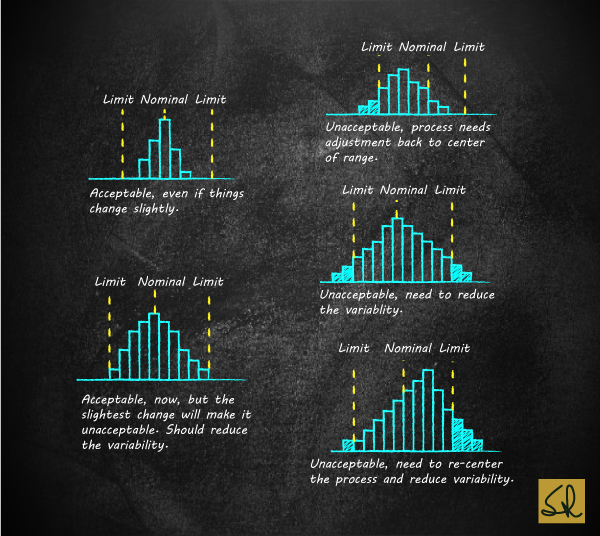
Histograms and Limits of Acceptability
Potential Pitfalls
There are three important pitfalls that a quality improvement team should be aware of when interpreting histograms:
- Before stating your conclusions from the analysis of the histogram, make sure the data is representative of typical and current conditions in the process.
- Do not draw conclusions based on a small sample. As a rule of thumb, use a sample of 40 for each histogram you wish to construct.
- Remember that your interpretation of the histogram is only a hypothesis that requires additional analysis and direct observations of the process in question.
Insight
A histogram is usually a bell shaped curve. What we end up seeing is a result of sorting the good from the bad. Examples: truncated histograms; bi-polar histograms; etc.
Look carefully for the phantom bell shaped histogram. Establish the Cost Of Poor Quality (COPQ) that you are unknowingly burdened with. Refer Quality Capsule #4
Next
In my next edu-blog, on Wednesday 28 October, I will introduce Scatter Diagrams. This is an effective quality tool for bi-variate analysis. It quantifies a cause-effect relationship..
Very nice refresher of an excellent tool to depict variation in the process and identify areas for improvement.
Good recap. Thanks for sharing Mr Lulla.
Thanks Sachin.